Time Series Trend Analysis and Quantitative Environmental Impact Assessments
- Start Date: March 03, 2026
- End Date: March 31, 2026
- Time: 9am-12pm. Pacific Time.
- City: Online via Zoom
- Instructor: Stefano Mezzini
- Registration full! Please contact office@cmiae.org to be placed on the waitlist
Course description
 Environmental Impact Assessments aim to determine the risk of environmental effects during and after the development of a new project. Statistical modeling allows analysts to estimate the effects the project will have and what measures can reduce or remove any adverse impacts. However, the results from statistical analyses are often not conveyed in clear and accessible ways, and they often focus on significance rather than biological relevance or risk.
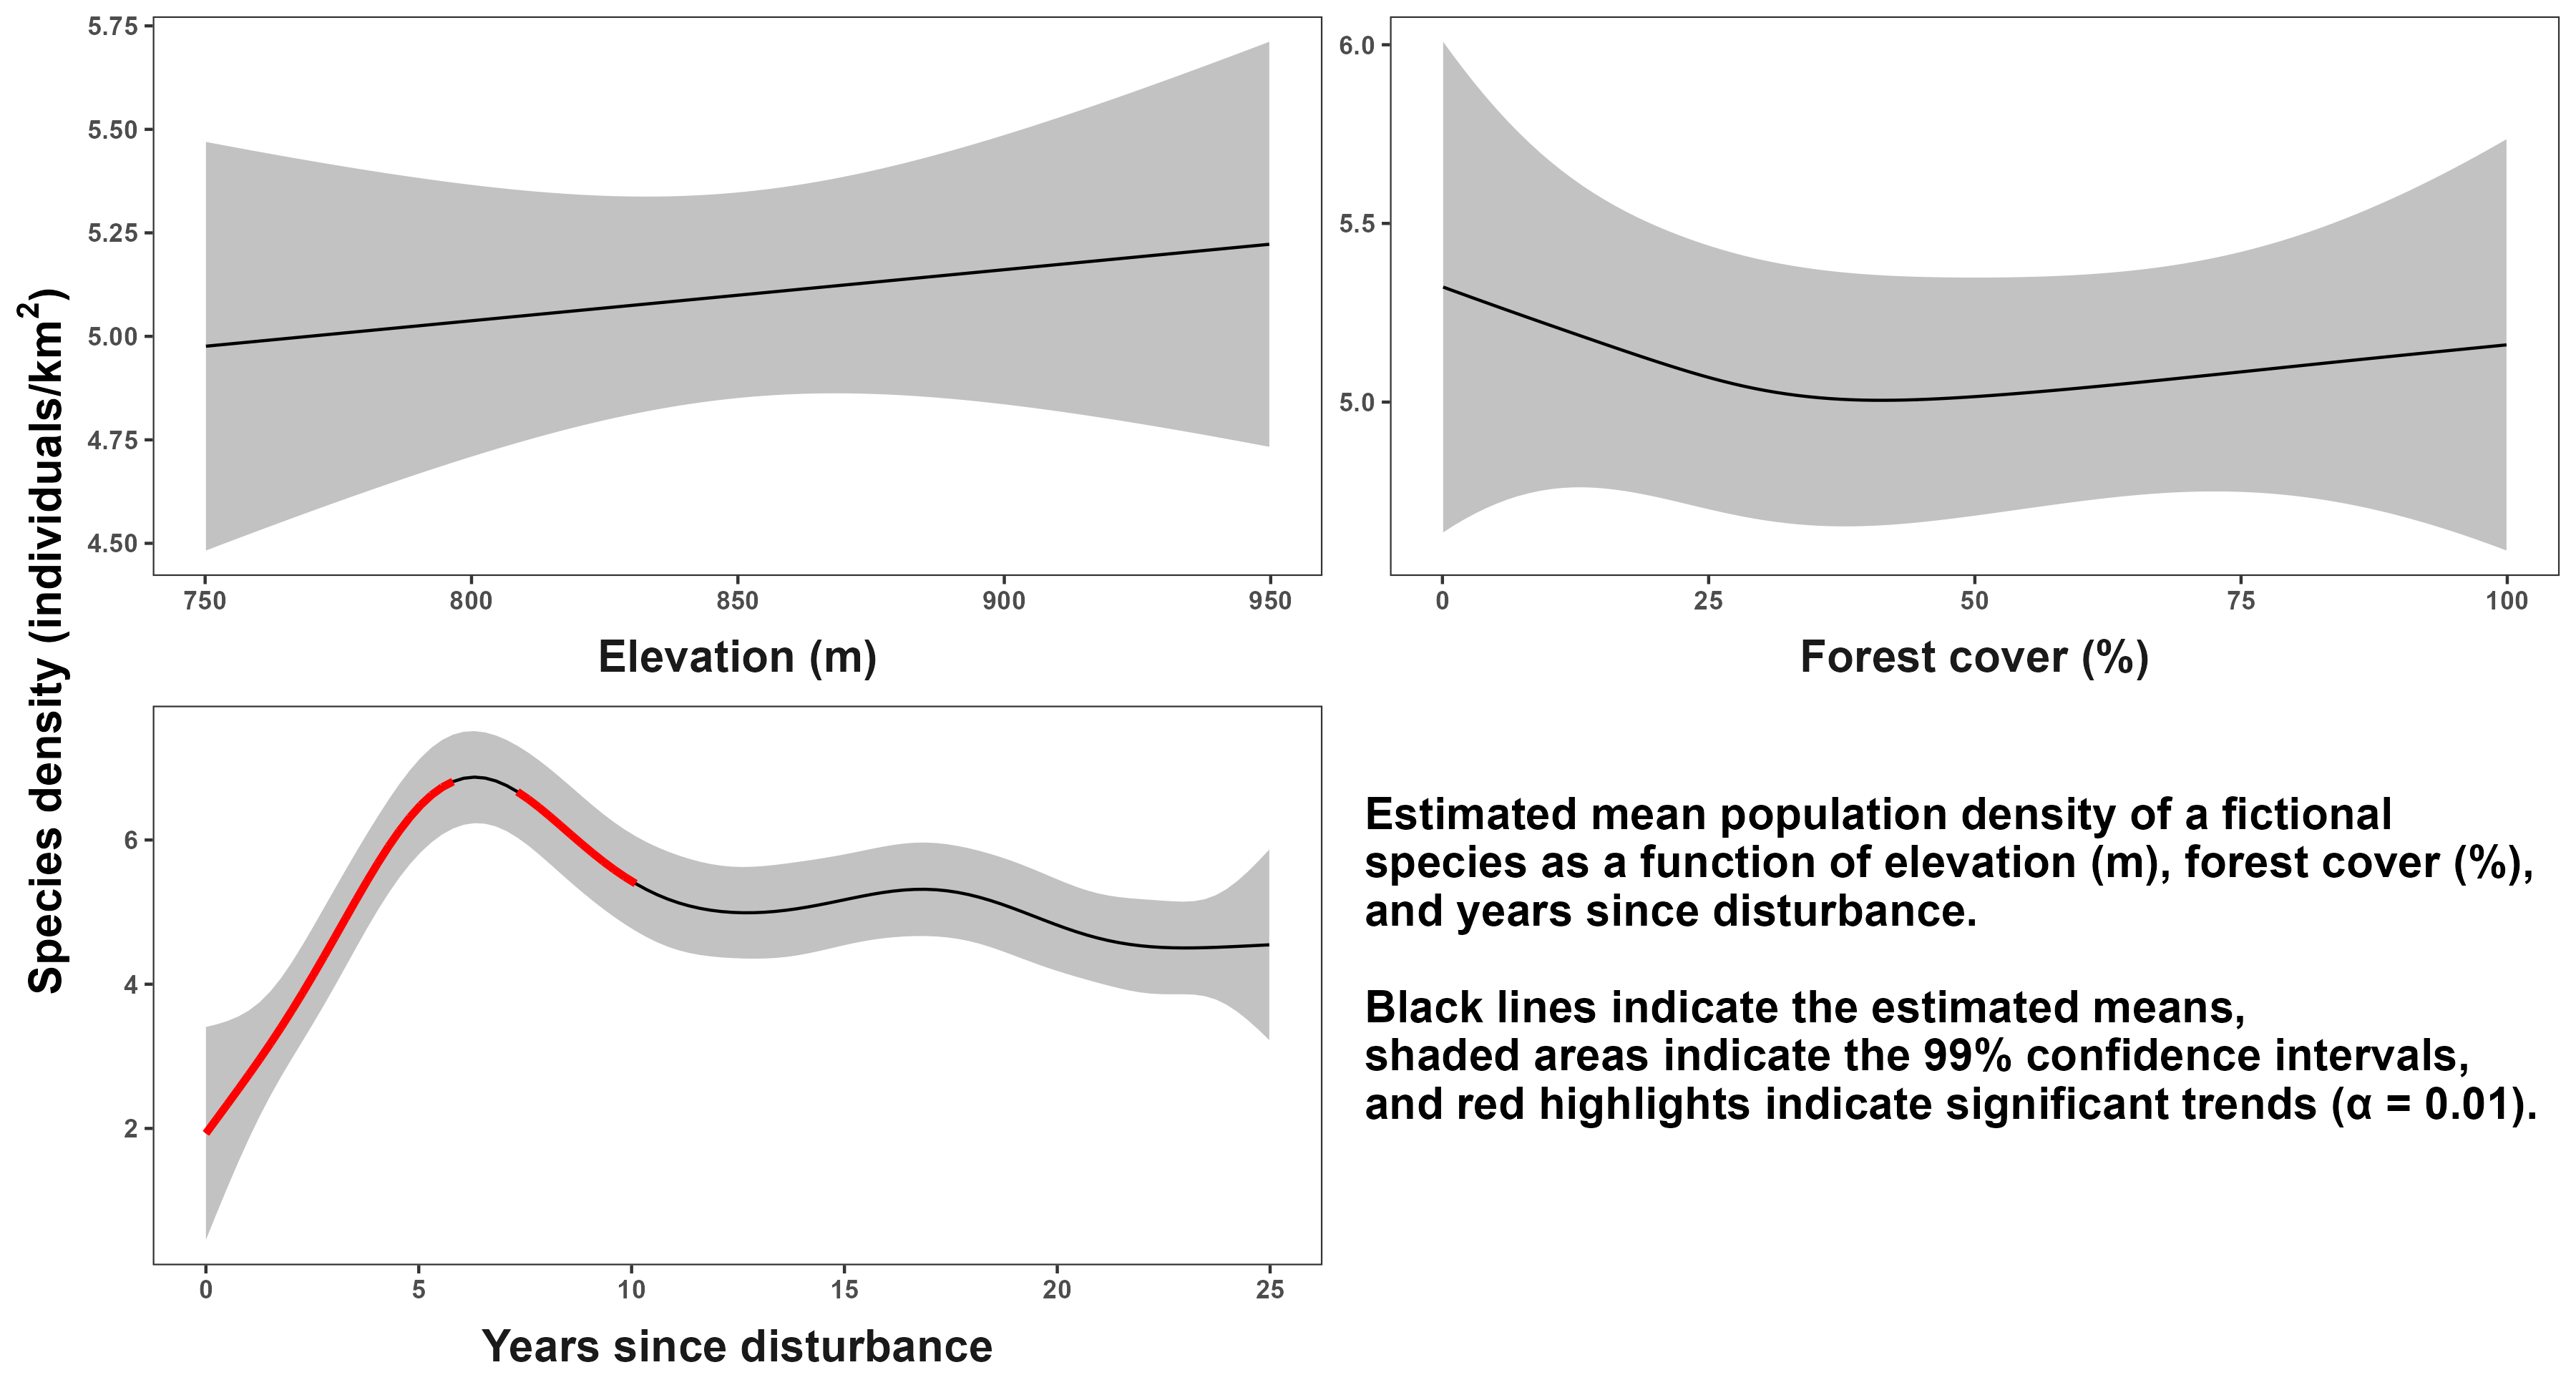
Trends over time are often estimated using statistical methods such as linear regression and non-parametric regression, but such models assume linear trends over time and can fail to disentangle trends from noise and autocorrelation. Generalized Additive Models (GAMs) allow analysts to detect nonlinear trends while allowing trends to be nonlinear yet understandable by a broad audience when presented in an accessible manner. This course will teach participants how to fit and interpret Generalized Additive Models and how to share results in simple and clear ways that are understandable by decision-makers, stakeholders, and the general public.
Course outline
This course will be delivered via three-hour online sessions over five Tuesday mornings, plus optional take-home work between each session. Note that attendees are encouraged to bring their own research questions, but we will not be able to address specific questions about data due to data sensitivity and time limitations. That said, Stefano will be available for one-on-one consultations to address any questions that attendees may have.
Day 1. Mar 3
Review of core statistical concepts: populations, samples, sample statistics, estimates, uncertainty (standard deviation, variance, standard error), confidence intervals, p-values, bias, precision, accuracy, power, hypothesis testing, statistical significance vs biological relevance, dealing with missing data.
Introduction to (linear) trend detection: fitting linear models (ANOVA, ANCOVA), signal vs error, predicting with LMs, limitations of linear models, polynomial models, interaction terms.
Day 2. Mar 10
Introduction to nonlinear trend detection: Part I: moving beyond Gaussian (Normal) data, link functions, fitting Generalized Linear Models, model diagnostics, limitations of GLMs.
Part II: fitting Generalized Additive Models, interpreting nonlinear terms, selecting model complexity, modeling seasonal and daily trends, model diagnostics.
Day 3. Mar 17
Applications of GAMs: plotting model terms, interpreting significance in GAMs, predicting with GLMs/GAMs, interpreting credible intervals in mgcv, creating publication-level figures, distinguishing noise from trend, deciding sampling frequency before data collection.
Day 4. Mar 24
Interpreting nonlinear models: detecting periods of statistically significant change, choosing how many years to monitor, estimating probability of surpassing a threshold, predicting beyond the range of available data.
Day 5. Mar 31
Hierarchical Generalized Additive Models: modeling data from multiple sites/individuals, random vs fixed effects, modeling large amounts of data.
Interpreting HGAMs: experimental design and inference (BACI design, control and treatment sites), interpreting random vs fixed effects, predicting out of sample, forecasting.
The Student Page is here. This page is password protected and provides students with easy access to all course materials needed including course recordings for a limited period of time.
Who should take this course?
This course is aimed at early-stage professionals or professionals looking to refresh and expand their skills, recent university or college graduates, and graduate students.
Prerequisites knowledge
- Basic proficiency with R >= 4.4.0 and RStudio.
- A basic understanding of the statistical concepts listed in the review part of the course objectives is recommended
Our instructor
Stefano Mezzini has almost a decade of experience in statistical modeling, including paleoecological time series, water quality time series, and animal tracking data. He is a supporter of open science, shares his research via GitHub and is celebrated for his teaching and communication skills. Stefano holds a BSc Hons. in Biology and a BSc in Statistics, and he is expected to defend his PhD in Biology in fall of 2025. He welcomes registrants to reach out with any questions about course material or beyond. You can contact Stefano via mezzini.stefano@gmail.com
Preparation and what to bring
Please come prepared with the following:
- A free account with RStudio Cloud
- tidyverse (version ≥ 2.0.0)
- Packages: mgcv (v. ≥ 1.9.1), gratia (v ≥ 0.10.0). See here
- Zoom. Follow that links for info on system requirements
- A good internet connection, microphone, and webcam.
- Two computer monitors are suggested
Registration
Registration includes workshop materials accessible via GitHub and course recordings for up to 2 months time.
Members: $470*
Non-members: $525
*Memberships can be purchased and renewed while you register. More info about memberships here.
Registration is now full. You can request to be added to the cancellation list by emailing office@cmiae.org
 Bursary opportunity!
Thanks to the generous support of Pig Brig we are able to offer a bursary to Indigenous community members and individuals working for Indigenous-owned organizations.
Pig Brig are at the forefront of addressing the many concerns around the spread of invasive feral pig populations in North America, and beyond. For more information, contact office@cmiae.org